
A Strong Finish to 2025—and Why Diversification Still Matters

Market Recap for the Week of December 29, 2025
2025 is officially in the books, and it was a strong year for nearly every major asset class. Returns were broad-based, rewarding investors who stayed diversified:
U.S. Stocks: +17.88%
International Stocks: +31.85%
Emerging Market Stocks: +34.40%
Gold: +64.33%
Bonds: +7.08%
Bitcoin: −6.18%
REITs: +2.30%
Commodities: +15.80%
Bitcoin’s decline likely shouldn’t come as a surprise after posting triple-digit gains in both 2023 and 2024—returns at that pace simply aren’t sustainable indefinitely. On the other end of the spectrum, 2025 marked the first time in many years that emerging market stocks meaningfully outperformed U.S. equities, and by a wide margin. Given their prolonged period of underperformance, a strong rebound was overdue.
This dispersion in results is a good reminder of why we own broadly diversified portfolios. Leadership rotates, often when least expected.
Looking ahead to 2026, the U.S. equity market enters the year with a forward price-to-earnings ratio of roughly 22x, which is elevated relative to long-term history. That doesn’t mean 2026 will be a bad year—markets can remain expensive for extended periods—but higher starting valuations generally imply lower long-term expected returns. This is another reason we diversify beyond U.S. large-cap stocks.
The U.S. market is also entering 2026 in a highly concentrated state. The top 10 stocks in the S&P 500 now represent over 40% of the index’s total weight. Historically, the relationship between market concentration and future returns is not clear-cut, making this more of a risk factor to monitor than a timing signal.
“From emerging markets to gold, 2025 proved that market leadership doesn’t stay in one place for long.”
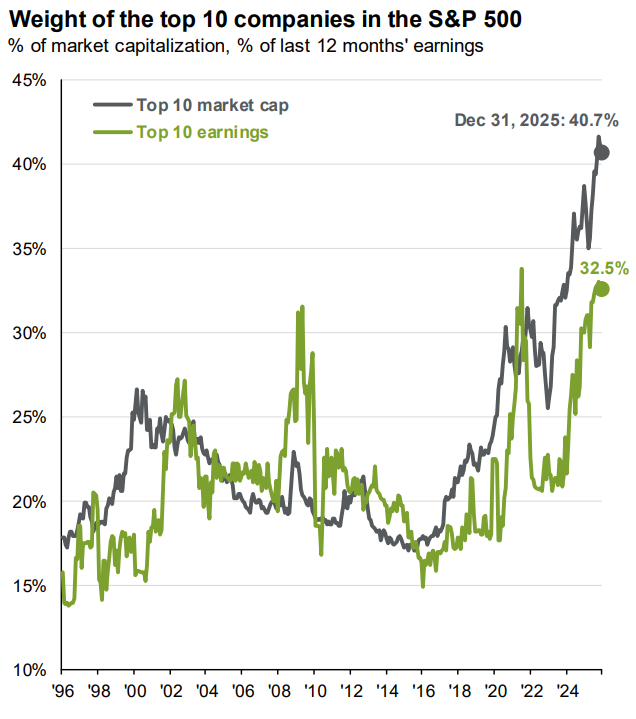
Chart of The Week
As highlighted above, the top 10 companies now account for nearly 41% of the S&P 500’s weight. Our chart shows historical concentration levels (grey line), and today’s reading stands out as unusually high—exceeding even levels seen during the dot-com era.
The chart also compares concentration to fundamentals. While those same 10 companies make up 41% of the index, they account for only 32.5% of total earnings (green line). That gap is worth watching as we move into 2026.
As always, diversification remains one of the most reliable tools investors have for navigating uncertainty—regardless of which asset class happens to be in favor at the moment.
The commentary in this blog is for informational purposes only and should not be taken as personalized investment advice
Sources: FactSet, Standard & Poor’s, J.P. Morgan Asset Management. Guide to the Markets – U.S. data are as of December 31, 2025.