
Strong Growth, Strong Markets—Even in a Holiday-Shortened Week

Market Recap for the Week of December 22, 2025
It was a shortened trading week for U.S. equity markets, with Christmas Eve and Christmas Day falling midweek. Despite the lighter schedule, investors received a meaningful positive surprise on Tuesday with the release of third-quarter GDP data. The U.S. economy grew at a 4.3% annualized rate in Q3, accelerating from 3.8% in Q2 and marking a clear rebound from the contraction seen in Q1.
The primary driver of this growth was consumer spending, which accounted for more than half of the overall increase—further reinforcing the resilience of the U.S. consumer despite higher interest rates.
As we approach year-end, the S&P 500 is nearing a 20% gain for 2025, which would mark the third consecutive year of 20%+ returns. Market performance this year has been driven by Nvidia, Alphabet, Broadcom, Microsoft, Apple, and Palantir—all firmly within the technology ecosystem.
Unsurprisingly, Technology is the best-performing sector in the S&P 500 this year, up approximately 30%, followed by Communication Services, which has gained about 21%. Consumer Staples is the only sector currently in negative territory, down less than 1% year-to-date.
The bond market has also delivered solid results. The U.S. Aggregate Bond Index is up roughly 7% this year. While that figure may seem modest compared to equity returns, it is worth noting that bonds typically experience about one-third the volatility of stocks, making this a strong year on a risk-adjusted basis.
“Consumer spending powered more than half of Q3’s 4.3% GDP growth, reinforcing the strength of the U.S. economy despite higher rates.”
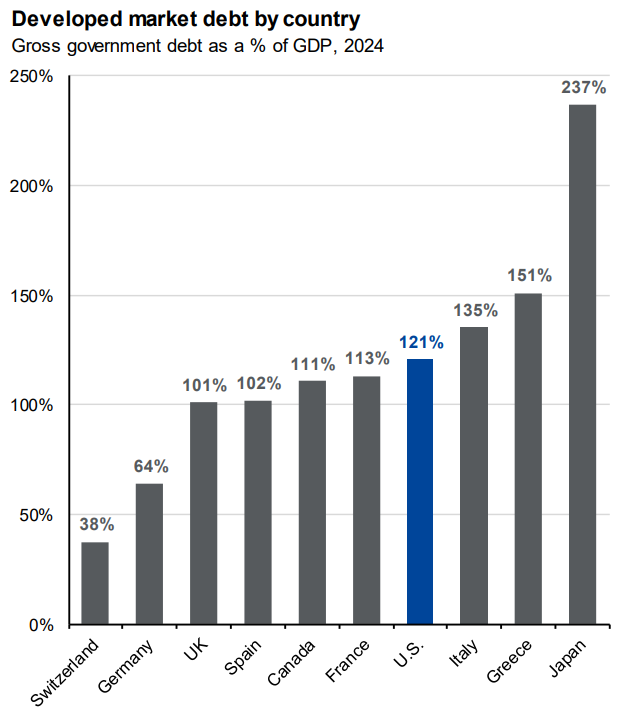
Chart of The Week
This week’s chart comes from the JPMorgan Guide to the Markets and highlights debt-to-GDP ratios across major developed economies. While the United States does carry a high debt burden relative to GDP, it is not the highest—Japan holds that distinction with debt exceeding 200% of GDP.
The broader implications of global debt levels are a topic for another day. For now, the chart provides helpful perspective on where the U.S. stands relative to its peers when measured against other large developed economies.
The commentary in this blog is for informational purposes only and should not be taken as personalized investment advice
Sources: Bloomberg, FactSet, J.P. Morgan Asset Management; WEO; U.S. Treasury Department.
General government gross debt includes all interest- and principal-bearing liabilities. Net debt equals gross debt minus financial assets. Treasury data reflect auctions across 2- to 30-year maturities. Data as of September 30, 2025.