
Market Leadership Starts to Rotate in Early 2026

Market Recap for the Week of January 5, 2026
The first full trading week of 2026 is in the books, and it brought an encouraging development for diversified investors: market leadership is beginning to broaden.
For much of the past year, a small group of mega-cap technology stocks—the so-called “Magnificent 7”—has driven the majority of market gains. That trend looks different as we start the new year. Year-to-date, the Magnificent 7 are up just 0.62%. Meanwhile, small-cap stocks have gained roughly 5%, emerging market stocks are up 4.44%, and value stocks (as measured by the Vanguard Value ETF) have risen about 3%.
This kind of rotation is healthy. When leadership spreads beyond a narrow group of stocks, it reduces concentration risk and creates more opportunities across the market. Over time, leadership needs to rotate—otherwise the same segment simply becomes more expensive, increasing risk for investors who are overly concentrated.
On the economic front, the December employment report showed the U.S. economy added just 50,000 jobs. Over the past six months, total net job growth has been only 87,000—remarkably weak compared to the nearly 500,000 jobs added during the prior six-month period. The takeaway is clear: the labor market continues to cool. A significant portion of the slowdown is coming from government job losses, which is not entirely unexpected.
“Early 2026 is showing signs of healthier market leadership, as gains spread beyond the Magnificent 7.”
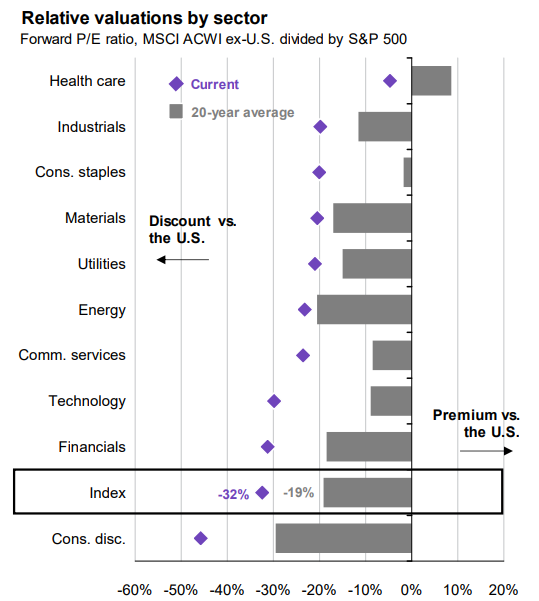
Chart of The Week
This week’s chart highlights the valuation gap between U.S. and international stocks, broken down by sector. The purple diamonds show that in every sector, international stocks are cheaper than their U.S. counterparts when measured by price-to-earnings (P/E) ratios. The gray bars represent the 20-year average.
The key message: international stocks are trading at an even larger discount to U.S. stocks today than they have, on average, over the past two decades. For long-term investors, this valuation gap is worth paying attention to.
The commentary in this blog is for informational purposes only and should not be taken as personalized investment advice
Sources: FactSet, MSCI, Standard & Poor’s, J.P. Morgan Asset Management.
Countries are represented by their respective MSCI country index except for the U.S., which is represented by the S&P 500.
Guide to the Markets – U.S. Data as of January 8, 2026.