
The Yield Curve Wakes Up

Market Recap for the Week of May 11, 2026
Last week we experienced a notable increase in long-term interest rates, with the 10-year yield adding approximately 20 basis points — rising from 4.39% to 4.59%. This move higher shouldn't come as a major surprise, given that year-over-year inflation is running at 3.8%, largely driven by the significant spike in oil prices.
The move up in the 10-year yield does increase the attractiveness of bonds relative to cash. Short-term interest rates sit at 3.50%, the 5-year is at 4.26%, and the 10-year is at 4.59%. In other words, the yield curve is upward sloping, meaning longer-dated bonds are offering more yield than shorter-dated ones. We had an inverted yield curve for quite some time, so this wasn't always the case. Now that the curve continues to steepen, it is worth reassessing the amount of duration in one's portfolio.
Because inflation is running hotter, the chances of a Federal Reserve rate cut this year have essentially disappeared. According to the CME's FedWatch tool, there is less than a 1% probability that interest rates will be lower in December than they are today.
“After an extended period of inversion, longer-dated bonds are once again offering more yield than short-term alternatives.”
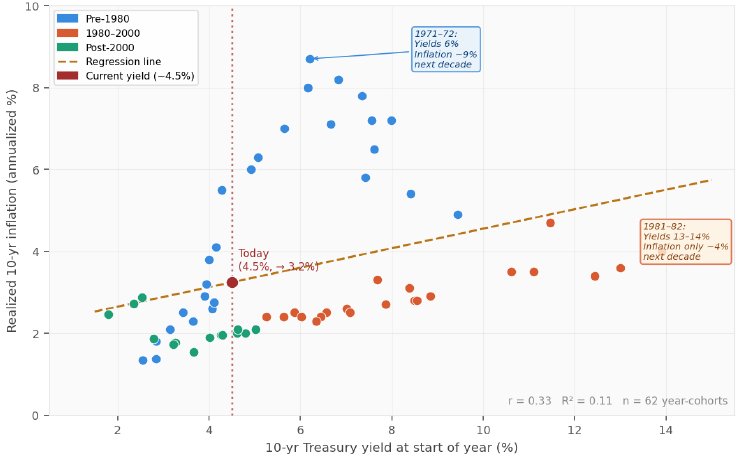
Chart of The Week
This week's chart examines the correlation between the 10-year Treasury yield and subsequent annualized inflation over the following 10-year period. What we find is that while some correlation exists, it is quite low. The typical argument goes that if rates and inflation are both rising, you are no better off — because the higher bond yield is offset by higher inflation. This would hold if the 10-year yield were a reliable predictor of future inflation, but as the chart illustrates, bonds have a poor track record in that regard. For that reason, we view entering bonds today at higher nominal yields as a more attractive entry point than at the start of the year.
The commentary in this blog is for informational purposes only and should not be taken as personalized investment advice
Source: Federal Reserve (FRED) for 10-year Treasury yields; Bureau of Labor Statistics for CPI-U. Realized inflation computed as annualized CPI change over the 10-year window following each start year.