
Inflation Nears Fed Target as CPI Rises 2.4%

Market Recap for the Week of October 13, 2024
The Consumer Price Index (CPI) is one of the most cited measures of inflation. Inflation measures how much prices are increasing on a year-over-year basis. The Bureau of Labor Statistics releases new CPI numbers every month. From the global financial crisis of 2008 until 2020, CPI numbers remained relatively low and, therefore, didn’t receive much attention. However, after hitting a multi-decade high of 9.1% in 2022, the CPI has become a very important indicator for both the economy and the stock market. The most recent reading, released on Thursday, showed a 2.4% year-over-year increase in the CPI. This is encouraging and very close to the Federal Reserve’s target of 2%. The two biggest contributors to September’s inflation reading were food and shelter. According to the BLS, these two categories accounted for 75% of the inflation for September.
It’s an important reminder that these low inflation readings do not mean prices are going down; they just aren’t increasing as rapidly. Falling prices are referred to as deflation, and while the CPI index as a whole remains in inflationary territory, some categories have experienced deflation in the past 12 months. Prices for used and new vehicles are down year over year, and energy prices have also seen significant declines. The stock market seems pleased with these numbers, as all major U.S. stock indexes were up about 1% over the past week. Technology, Industrials, and Financials were the best-performing sectors, while Utilities lagged behind, down 2.55%.
“September’s CPI rose 2.4% year over year—encouragingly close to the Fed’s 2% target.”
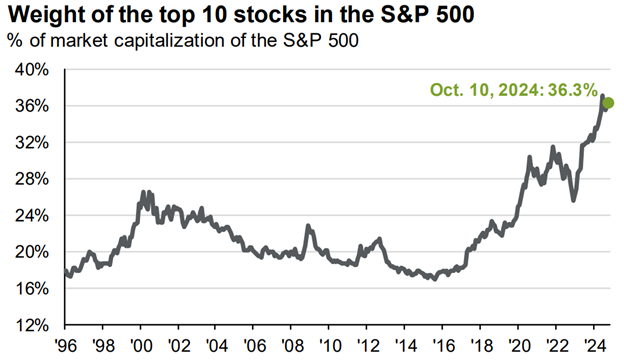
Chart of The Week
Most people are familiar with the S&P 500, an index of the 500 largest U.S. publicly traded companies. Many mutual funds and exchange-traded funds are designed to track the performance of the S&P 500 index. What some people may not realize is that the index is market-cap weighted, meaning the most valuable companies have a larger weight in the index. The alternative would be an equal-weighted index, where each of the 500 stocks shares the same weighting. In this case, each stock would have roughly a 0.2% weight. The chart of the week shows how much weight the top 10 stocks currently have in the S&P 500. As you can see, concentration in the S&P 500 is at an all-time high, meaning the performance of those top 10 stocks will significantly impact the index’s returns. This isn’t necessarily a problem, but it’s important for investors to understand how different indexes are constructed so they can ensure they are properly diversified.
Source: FactSet, Standard & Poor’s, J.P. Morgan AssetManagement. The top 10 S&P 500 companies are based on the 10 largest index constituents at the beginning of each month. As of 9/30/2024, the top 10companies in the index were AAPL (7.1%), MSFT (6.5%), NVDA (6.1%), AMZN (3.6%),GOOGL/GOOG (3.6%), META (2.5%), BRK.B (1.7%), AVGO (1.7%), TSLA (1.5%) and LLY(1.4%).The remaining stocks represent the rest of the 492 companies in theS&P 500.
Guide to the Markets – U.S. Data are as of October 10, 2024.